Fit scan of Ohmic contact
The core function used in this example is fitOhmic. The input for this function is a resistance plot; the linear relation between the bias voltage over and the current through the device. In this example a sample dataset is created; a linear relation with some random noise.
[1]:
%matplotlib inline
import qcodes.tests.legacy.data_mocks
from qcodes.plots.qcmatplotlib import MatPlot
import numpy as np
import qtt
from qtt.algorithms.ohmic import fitOhmic
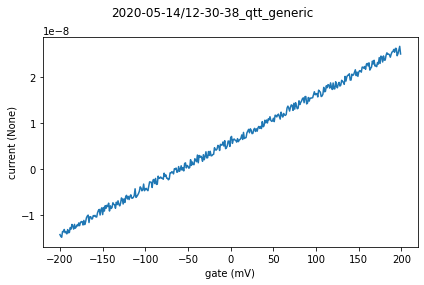
ds = qcodes.tests.legacy.data_mocks.DataSet1D()
x = np.arange(-200, 200)
y = 1e-10 * (x + 50 + 20 * np.random.rand(x.size))
ds = qtt.data.makeDataSet1Dplain('gate', x, xunit='mV', yname='current', y=y)
_ = MatPlot(ds.default_parameter_array())
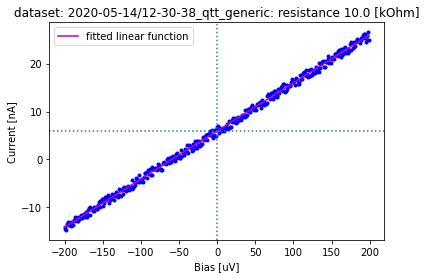
Fit the data with a linear function and plot the results. The ‘fitOhmic’ function will return a dictionary with the fit parameters (directional coefficient, intersection), the ohmic resistance and the biascurrent.
[2]:
r = fitOhmic(ds, fig=300, gainx=1e-6, gainy=1)
[3]:
print(r)
{'fitparam': array([1.00426032e-04, 5.95574163e-09]), 'resistance': 9957.577568364948, 'biascurrent': 5.955741625514289e-09, 'description': 'ohmic'}
[ ]: