Measurements
To perform measurements several tools are available.
Scan functions
For basic scanning the following functions are available:
|
Simple 1D scan. |
|
Make a 2D scan and create dictionary to store on disk. |
|
Make a 2D scan and create qcodes dataset to store on disk. |
|
Perform a very fast 2d scan by varying two physical gates with the AWG. |
For more advanced measurements, write your own data acquisition loop.
Plotting data
For plotting a qcodes.DataSet one can use
|
Plot a dataset to matplotlib figure window |
To automatically copy a plotted figure to PowerPoint one can add a button:
Create a button on a matplotlib figure to copy data to PowerPoint slide. |
Parameter viewer
The ParameterViewer widget allow to view and set numeric parameters of instruments. To start the ParameterViewer pass the instruments to be monitored as the first argument.
parameter_viewer = qtt.gui.parameterviewer.ParameterViewer([gates, keithley1], start_timer=True)
parameter_viewer.setGeometry(100,100, 400, 800)
Simple class to show qcodes parameters |
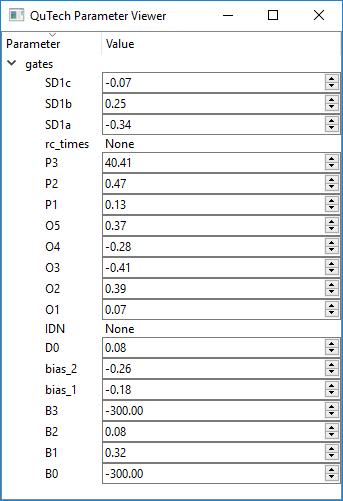
ParameterViewer widget
VideoMode
The videomode tool can create fast charge stability diagrams using a 1D or 2D sawtooth wave. For more information see the code or the example notebooks.
|
Controls the videomode tool. |
Data browser
The data browser can be used to inspect recorded data.
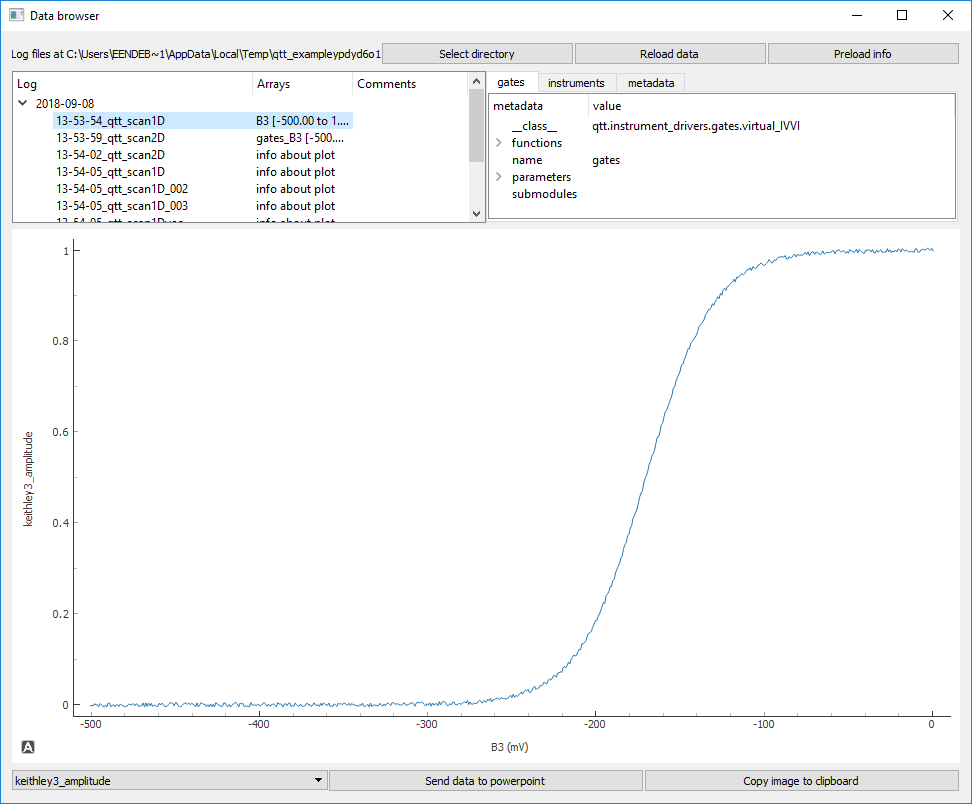
DataViewer widget
Live plotting
Live plotting is done using a qcodes.QtPlot window. The window can be setup with:
Create liveplot window and parameter widget (optional) |
Named gates
The VirtualDAC object can translate gate names into the proper channels of a DAC (or multiple DACs).
This is convenient because gate names are easier to work with than a number. Also when a device is controlled with multiple DACs.
This class maps the dacs of IVVI('s) to named gates. |
Measurement control
A simple GUI to abort running measurements without interfering with the instrument communication.
Simple control for running measurements |
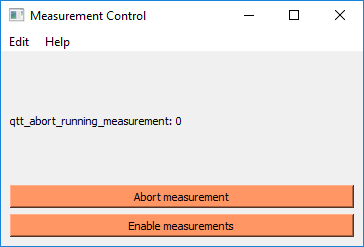
Measurement control widget
Virtual gates
|
A virtual gate instrument to control linear combinations of gates. |
Storing the system state
To store the system state one can store the station.snapshot(). In order to restore the state,
it is often sufficient for spin-qubits to restore the DAC values.
Copying data to Powerpoint
To copy a dataset or a figure window to Powerpoint, including the scan metadata one can use:
|
Add slide based on dataset to current active Powerpoint presentation. |
|
Add slide to current active Powerpoint presentation. |